Study Method
 Blended
Start Date
 Jan 13 2022
Length of Course
 TBA
Fees
 795 per person
Location
 TBA
Excel for Reward Masterclasses: 5 afternoon sessions
Five virtual masterclasses. Attend from your home or any location. No travel required.
EXCEL FOR REWARD – MASTERCLASS #1
Creating Self Updating Grading Matrices
Date: Thursday 13 January 2022
Time: 1pm to 3pm (UK)
Duration: Two hours including five-minute break at approx. 2pm
Venue: Your PC
Once your jobs have been evaluated, using either a job content or market pricing approach, your reward team and management need to audit and view the grades by grade and by function (or job family, discipline, business unit, division, area, company).
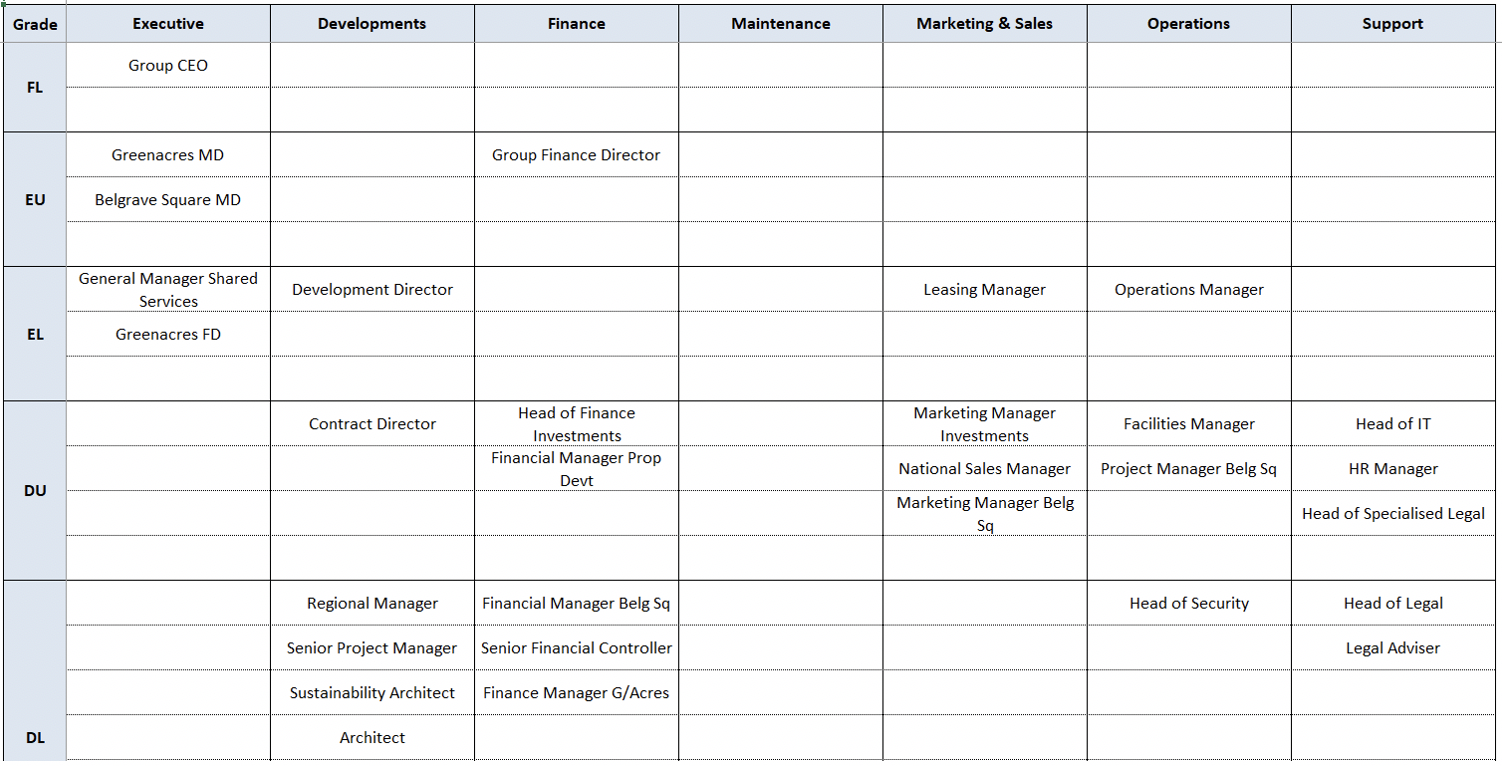
To conduct a meaningful audit, the jobs need to be in a matrix form rather than in a long list. This enables an equity / consistency check:
- horizontally – similar grades across different functions
- vertically – grade differences within each function
This matrix also presents the job grade data in a user-friendly and accessible format for viewing of grades and determining of career paths, as shown in the screenshot.
All too often, these grading matrices are high maintenance and error prone, as:
- jobs change constantly – new jobs, obsolete jobs, changes to job title or grade
- organisation structures and function names often change
- reward practitioners need to remember to update the matrix when jobs / grades / functions change
- the update is tedious and time consuming, as each job needs to be placed in the right function and grade, old jobs need to be moved or deleted, checks need to be done for duplicates
- the number of rows in the matrix constantly has to be adjusted to cater for more or less jobs in each grade; lots of blank rows left in the matrix make it difficult to read and print
During this Excel masterclass, Dianne will demonstrate how to transform this time-consuming and error-prone process into a streamlined, accurate, low-maintenance approach. She will show you how to:
- Use Power Query to create the source data for the grading matrix from payroll / HRIS data
- Create a grading matrix that updates automatically from a list of functions, jobs and grades
- Add an extra dimension / drop-down to the grading matrix, so that the organisation can have a separate grading matrix for each company, geographical area or business unit, all reading from the same list of jobs
- Record a macro that will adjust every grading matrix in the file to show the required number of rows per grade
- Update all grading matrices from payroll / HRIS data with two clicks
- Create the grading matrices using formulas (for legacy Excel users) or dynamic arrays (for Microsoft 365 users)
Attendees will be provided after the session with the Excel spreadsheets demonstrated and detailed instructions, so that they can replicate the functionality with their own grading data.
Who should attend?
Reward and HR practitioners who work with grades and would like to know how to transform data from a list to a matrix.
EXCEL FOR REWARD – MASTERCLASS #2
Transforming Reward Data with Macros
Date: Thursday 27 January 2022
Time: 1pm to 3.30pm (UK)
Duration: 2.5 hours including five-minute break at approx. 2pm
Venue: Your PC
Do you need to carry out the same repetitive sequence of steps on your employee data every week, month or quarter? If so, macros can transform your life by automating the series of steps to run with a single click, saving you hours and hours of time and tedium.
Many of us are often nervous of macros; some of us are even scared to use them. But, in this Excel masterclass, Dianne will demystify macros. She will show you how to record them, run them and edit them to get the macro to run on every worksheet.
She will also teach you how to write some simple macros from scratch using variables, operators, message and input boxes, conditional structures and loops.
In this course Dianne will demonstrate, using reward examples, how to:
Part 1 – Record and run macros:
- Enable the Developer menu to work with macros
- Record macros to automate repetitive tasks
- Run macros using key strokes or by assigning them to a shape
- Edit, re-name and delete macros
- Debug macros
- Set macro security settings
Part 2 – Write simple macro code:
- Work with the Visual Basic Editor
- Write simple macros from scratch
- Declare variables and work with operators in macros
- Use input and message boxes to get user input
- Apply simple conditional structures in macros
- Use a loop structure in a macro
Attendees will be provided after the session with the Excel spreadsheets demonstrated and detailed instructions, so that they can replicate the functionality with their own reward data. After this course delegates should feel confident enough to record, run, edit and write simple macros to automate repetitive rewards work.
Who should attend?
Reward and HR practitioners who need to do regular, repetitive work on employee data and would like to know how to automate the work to run with a single click.
EXCEL FOR REWARD – MASTERCLASS #3
Using Excel Power Query to Transform your Reward Work
Date: Thursday 10 February 2022
Time: 1pm to 3pm (UK)
Duration: Two hours including five-minute break at approx. 2pm
Venue: Your PC
Watch Dianne demonstrate one of the smartest and most powerful tools ever developed for Excel. Power Query comes standard with Excel 2016 / 2019 / Office 365, and is available as an add-in to Excel 2010 / 2013.
Dianne will show you how it can automate routine data transformation (e.g. merging / splitting / removing columns, filtering data, replacing data, rounding, sorting, converting text to numbers and dates). She will demonstrate how you can achieve this without using macros and VBA, and with hardly any formulas.
Almost all the transformation is done through the simple use of a menu and a mouse.
Dianne will show you how to merge and transform multiple files in a folder, then how to add / transform another file from the folder simply by clicking Refresh. You can scrape data from web tables, transform the data for use in an Excel file, then update it with a single click.
Dianne will demonstrate:
- How to merge and transform three monthly files of labour turnover data for use in a pivot table, then load / transform the next three monthly files and update the pivot table with a single click.
- How to calculate medians per gender / job title.
- How to scrape exchange rate data from the web, use the data in a formula to convert multi-country salaries to a single currency, and update data with a single click.
- How to pivot employee salary data into different business units for use in scatter charts and pay structure design.
- How to unpivot problem sales commission data for use in analysis.
- Power Query’s AI capability of adding a column based on examples.
EXCEL FOR REWARD – MASTERCLASS #4
Designing Powerful Excel Dashboards
Date: Thursday 24 February 2022
Time: 1pm to 4pm (UK)
Duration: Three hours including two 10-minute breaks
Venue: Your PC
This three-hour lesson will demonstrate and teach you how to create beautiful HR or rewards dashboards that stand out from the herd, tell a powerful story and can be updated with only two clicks. (Not to mention, impress the boss!)
Dianne will show you the wonders of Power Pivot:
- Cover important dashboard design principles.
- Provide a brief introduction to Power Query and Power Pivot and Macros.
- Demonstrate how to create an interactive gender equity analysis dashboard using Power Query, Power Pivot, icons, text boxes, elegant uncluttered colour coded charts, customised slicers to drill down by level, department or location, Power Pivot median measures and three simple macro buttons that allow alternate pay base views of the data.
- Dianne will give you a marvelous starting template along with instructions for replication of everything she will be demonstrating, and the finished dashboard to polish it all off.
- The gender equity analysis dashboard is used for illustration, but the techniques demonstrated can be used for any type of HR or rewards dashboards.
- Power Pivot and Power Query are standard from Excel 2016 onwards, and they can be added into Excel 2013. But the dashboard design principles taught can be used with any version of Excel, and can be used with standard employee data and pivot tables.
- Power Query and Power Pivot are simply super-efficient tools for transforming data and merging different tables for use in analysis.
EXCEL FOR REWARD – MASTERCLASS #5
Using Regression Analysis and Dynamic Arrays to Transform your Pay Structure Work in Excel
Date: Thursday 10 March 2022
Time: 1pm to 3pm (UK)
Duration: Two hours including five-minute break at approx. 2pm
Venue: Your PC
Join International Excel Guru, Dianne Auld as she demonstrates how to create pay structures and pay scale charts using exponential regression, pay scale formulas, scatter charts, combo charts and dynamic arrays. This is a highly practical watch – it’s not only captivating but it’s also invaluable to anyone involved with creating or maintaining pay structures.
Dianne will demonstrate:
- A quick overview of linear and exponential regression – when to use each one, the formulas used and interpretation of R squared.
- How to create a scatter chart and how to use exponential regression to create a pay midpoint line taking into account internal employee and market pay data.
- How to calculate the pay ranges for this pay line and plot the pay ranges as lines on the scatter chart.
- Using the same data to create a scatter chart but with traditional rectangular pay ranges and alpha or alpha numeric grades on the X axis – this is a complex chart to create as it involves a combination of a scatter chart, lines and stacked columns. It has to be created in a very specific way.
- Once learnt, you will use this chart in all your pay structuring work and wonder how you ever coped without it. Past students have loved the visual representation clearly showing how good a fit the pay ranges are relative to the employee pay scatter.
- Calculating median market data per grade, using a traditional array formula or using Office 365 dynamic arrays (available to Office 365 users), and adding this to the chart.
- Using dynamic arrays SORT, UNIQUE and FILTER formulas, array reference notation and data validation to create the same chart allowing a drill down per department.
- How to create a dashboard of department scatter charts all linked to one source data sheet.


“Reward Blueprints: 'This report on market data is something that I wished I could have had on my desk to read when I started my career in remuneration a number of years ago.'”
“ Excel April 2015: 'Good central location. Course content was well put together, very relevant to work and was made interesting by Dianne. I would highly recommend the course to any”
“Compensation Software Showcase 2014: ‘There was a lot that I could take away and share with my HR Team. In addition, I appreciated having a bit of one-to-one time with the vendors. ”
“ Annual conference 2015: ‘Thank you again for putting on such a great conference last week.’”
“Excel Advanced Nov 2015: 'Very happy!'”
“Gender diversity – UK boards: 'E-reward has done some excellent research on the penetration of women to senior board roles.' ”